Analytics QS
This topic explains how to add an analytics policy to your API. This policy connects your API to the powerful Apigee Edge Analytics Services.
Apigee Edge Analytics Services collects and analyzes a wealth of information that flows through APIs. This information is gathered, analyzed, and provided to you immediately, in real time. How is your API traffic trending over time? Who are your top developers? When is API response time fastest? Slowest? Are you attracting more developers? Geographically where do you see the most API traffic? Where are errors occurring?
The answers to questions like these help you improve your APIs, attract the right app developers, troubleshoot problems, and, ultimately, make better business decisions related to your API program.
- Be sure the
volos-analytics-apigeemodule is listed in your project's package.json file. If not, add it and runnpm install. - You must create or select an a127 account that include the
apigeeprovider. The command for creating an account isa127 account create <name>. - Create a RemoteProxy service. See Understanding remote services.
- Bind the service to your project with
a127 project bind <service name>. The remote proxy is automatically deployed to Apigee Edge. It serves as a communication conduit for analytics data between Edge and your a127 API. - Declare the analytics policy in the
a127-servicespart of your project'sapi/swagger/swagger.yamlfile. For example:
   analytics:
     provider: "volos-analytics-apigee"
     options:
       key: *apigeeProxyKey
       uri: *apigeeProxyUri
       proxy: WeatherExample,
       bufferSize: 100,
       flushInterval: 10,
batchSize: 10- Apply the analytics policy to each path you for which you want to collect analytics data. For example:
  /weather:
    x-swagger-router-controller: weather
    x-a127-apply:
analytics: {}You can configure these options in the a127-services declaration:
-
bufferSize: The maximum number of records to be stored in memory.
-
proxy: The name of the API proxy. This is the name that will show up in the Analytics dashboards.
-
flushInterval: Intervals at which records are uploaded to Apigee, in miliseconds.
-
batchSize: The number of analytics records sent to Apigee in each batch.
Run the application, by executing a127 project start. Test the program using curl. For example:
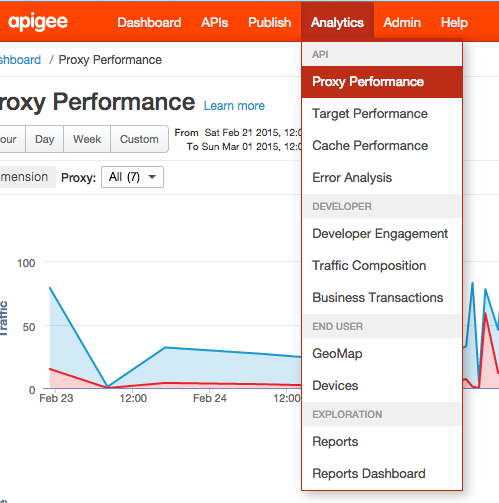
$ curl http://127.0.0.1:10010/weather\?city\=San%20Jose,CARun the command at least ten times. Then you can verify that the analytics shows up on the Apigee UI by looking at Proxy performance under the Analytics menu, as explained next.
- Log in to the Apigee Edge management UI.
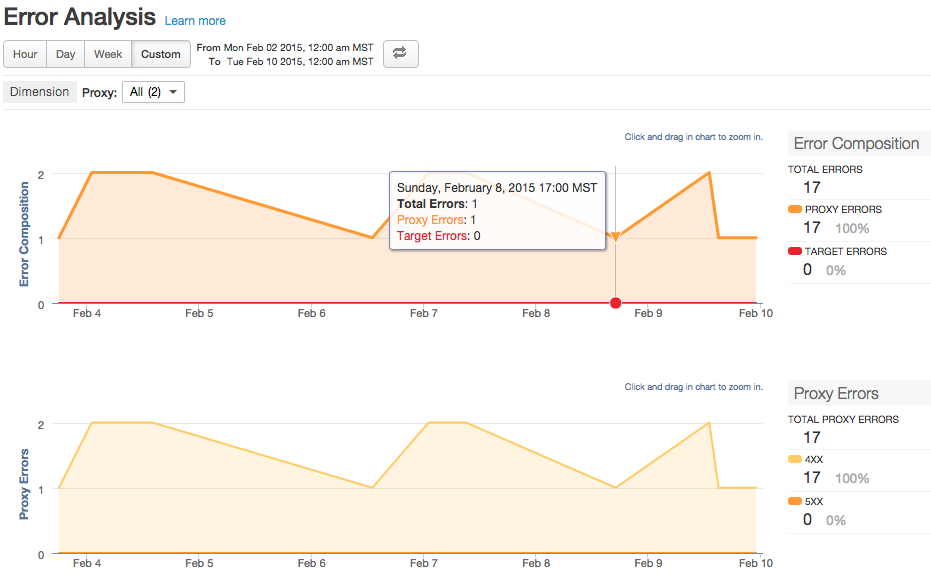
- Select Analyze > Proxy Performance to bring up the Proxy Performance dashboard.
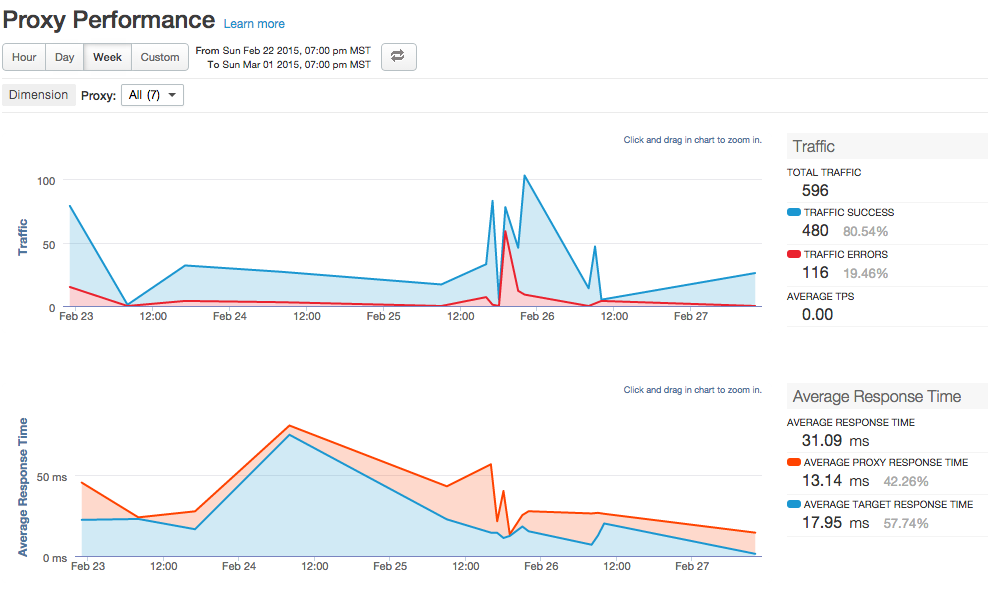
This dashboard helps you see API proxy traffic patterns and processing times.
Try out some of the other dashboards:
For more info about Apigee Analytics and the Analytics dashboards, see these Apigee Edge doc topics: